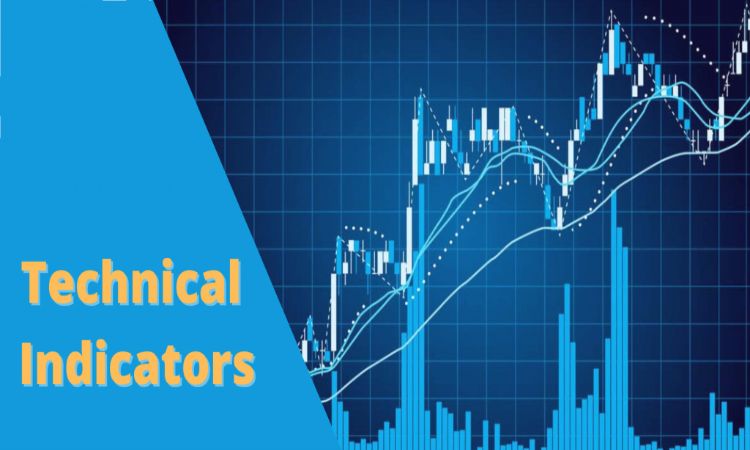
Trading isn’t just clicking buttons and hoping for the best. Most people who start don’t really know what they’re looking at. Candlesticks, volumes, moving averages, it’s a lot. But once you’ve been in the market long enough, you realize a few stock market indicators actually help. They don’t guarantee anything, but they tell you when to slow down, when to wait, and sometimes when to jump in.
Here’s a breakdown of 10 indicators worth knowing. Not because they’re fancy, but because they work more often than they fail.
1. Moving Averages
This one is everywhere. A 50-day or 200-day average smooths out the daily noise. If the price stays above the moving average, the trend might still be up. Not always, but worth watching.
2. RSI (Relative Strength Index)
When RSI goes above 70, that usually means too many people are buying. Below 30? Maybe people overdid the selling. You don’t act on this alone, but it’s a red flag either way.
3. MACD
This is about momentum. When two lines cross, it tells you if buyers or sellers are gaining strength. Some traders swear by it, others barely use it. Still worth learning.
4. Volume
If a stock moves up with low volume, it’s shaky. If it moves with high volume, it’s serious. No fancy formula. Just logic.
5. Bollinger Bands
Price moves inside two lines. When it breaks outside, it might mean something’s changing. It either keeps going or snaps back. Doesn’t give clear direction but shows you when something’s heating up.
6. Support and Resistance
These are levels. Every stock has a point where it stops falling (support) or stops rising (resistance). These aren’t fixed numbers. But if a stock bounces off the same zone twice, it’s probably worth noting.
7. VWAP
VWAP shows the average price a stock traded during the day, based on volume. If it’s trading above VWAP, bulls are probably in control. If it is trading below it, then maybe not.
8. LTP & Using an LTP Calculator
LTP means last traded price. Some people just watch that number move all day. But others use an ltp calculator to check entry price averages, small gaps, or real-time price zones. Fast traders use it a lot.
9. Fibonacci Levels
It’s math-based, but in trading, it’s more visual. These levels often show where a pullback might pause. You see it work enough times, you stop asking why.
10. Stochastic Oscillator
Similar to RSI, but more sensitive. It helps you catch earlier signs of reversal. Doesn’t always work, but when it lines up with other indicators, it gets your attention.
Wrap Up
Stock market indicators won’t do the thinking for you but they can definitely help you see things clearer. Try using two or three together. See how they play out. Keep the ones that feel right to you. And when prices start shooting up or crashing hard, simple tools like an LTP calculator can give you that quick reality check. Just don’t go in blind.
Markets don’t wait for anyone. And no single indicator works every time. What really matters is your awareness, knowing when to make a move, when to sit it out, and when to just step back completely.
